
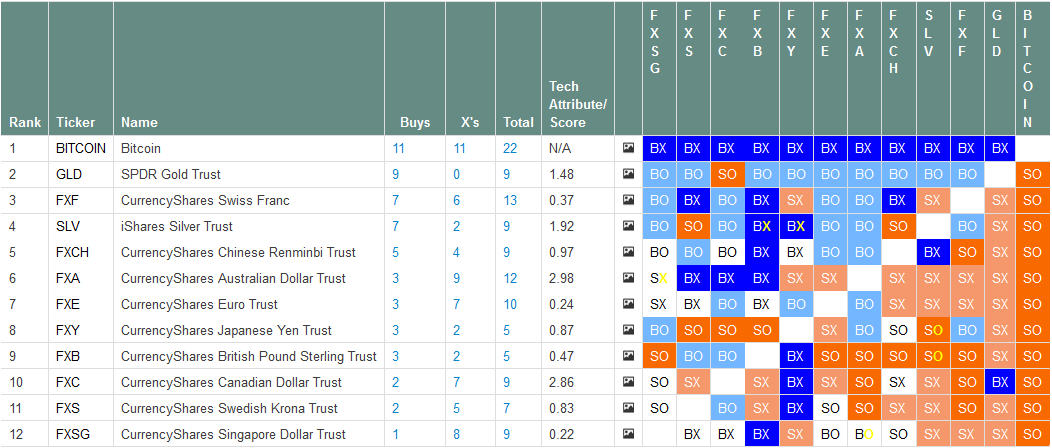
The Matrix below uses relative strength technical analysis to show how Bitcoin ranks against foreign currency ETF’s listed on US exchanges. Top relative strength candidates “float to the top”; while weaker candidates “sink to the bottom”. Click chart to enlarge.
HOW TO READ THIS CHART
- Relative strength measures the performance of one security in comparison to another. For example, how Microsoft is performing compared to the S&P 500, or how the U.S. Dollar is doing relative to the Euro, or how Bitcoin is doing relative to other Exchange Traded Funds and asset classes. To calculate relative strength, take the price of one security and divide it by the other (the security you want to compare), then plot the daily values using Point & Figure charting. While relative strength signals last on average about two years, an investor can also look to relative strength relationships for near term guidance.
- Technical Attributes/Score is a ranking system that is applied to all stocks using both trend and relative strength analysis. Stocks & ETF’s with at least 3 out of 5 technical attributes positive are considered to be “solid citizens”, and are desirable to buy or hold. Stocks with 2 or fewer technical attributes are most vulnerable to declines.
- Chart courtesy of Dorsey Wright & Associates. Please read our Disclaimer at: https://cenaclecapital.com/about-cenacle/disclaimer/
- For informational purpose only. Not a recommendation to buy or sell. Cenacle Capital holds small positions in Bitcoin, Ethereum and other alt-currencies.
- For more information about Guggenheim Currency Shares visit https://www.currencyshares.com/about-us/product-attributes